Azure Container Apps Observability
Azure Container Apps Observability
Observability provides deep insights into application behavior, performance, and reliability. While organizations often monitor workloads on Azure Kubernetes Service (AKS) or Virtual Machines (VMs), Azure Container Apps (ACA) introduces a serverless container environment where telemetry collection is slightly different.
With ACA, you can apply the same concepts using metrics, logs, and traces, tailored for event-driven, scale-to-zero workloads.
Using OpenTelemetry, you can instrument your ACA applications to collect:
- Metrics: measure CPU usage, memory consumption, request latency, and throughput.
- Logs: capture application events, errors, and operational messages.
- Traces: track request flows across microservices and internal APIs, helping identify performance bottlenecks.
By sending this telemetry to Azure Monitor and Application Insights, you gain full observability over your ACA workloads. You can visualize application health, detect anomalies, and troubleshoot issues quickly, while maintaining consistency with how you monitor AKS or VM workloads in your Azure environment.
In this tutorial, we will set up OpenTelemetry in Azure Container Apps using the OpenTelemetry Collector.
The goal is to enable end-to-end observability by collecting metrics, logs, and traces from your serverless containerized applications and sending them to a backend such as Application Insights.
What is OpenTelemetry?
OpenTelemetry is an open-source observability framework that provides a vendor-neutral standard for collecting telemetry data (traces, metrics, and logs).
It allows developers and platform engineers to gain visibility into distributed systems, troubleshoot issues, and optimize performance without being locked into a single monitoring provider.
The OpenTelemetry Collector
The OpenTelemetry Collector is a vendor-agnostic component that can receive, process, and export telemetry data. It plays a central role in observability pipelines by:
- Ingesting data from multiple sources (applications, services, infrastructure).
- Processing and enriching telemetry data (e.g., batching, sampling, filtering).
- Exporting telemetry to backends like Azure Monitor, Jaeger, Prometheus, or Grafana.
When deployed inside Azure Container Apps, the Collector can be used to capture observability data across microservices running in your environment.
Why Use OpenTelemetry with Azure Container Apps?
Azure Container Apps is a fully managed serverless container service that simplifies running microservices and event-driven applications.
Adding OpenTelemetry provides:
- Unified observability across multiple services and environments.
- Improved debugging with distributed tracing.
- Performance insights through custom and system metrics.
- Flexibility to export data to multiple monitoring backends.
This approach allows you to move beyond basic logging and gain deep observability into your applications and infrastructure.
Tutorial Scope
This guide will walk you through setting up a complete observability pipeline and deploying sample applications using Azure services.
- Configure an OpenTelemetry Collector for telemetry data collection.
- Deploy the OpenTelemetry Collector within Azure Container Apps.
- Set up the Collector to receive telemetry data from your applications.
- Validate telemetry collection using sample applications.
- Deploy the required observability infrastructure.
- Build your application and push container images to an Azure Container Registry.
- Deploy both the web application and the web API.
- Test and verify the deployed applications and the observability setup.
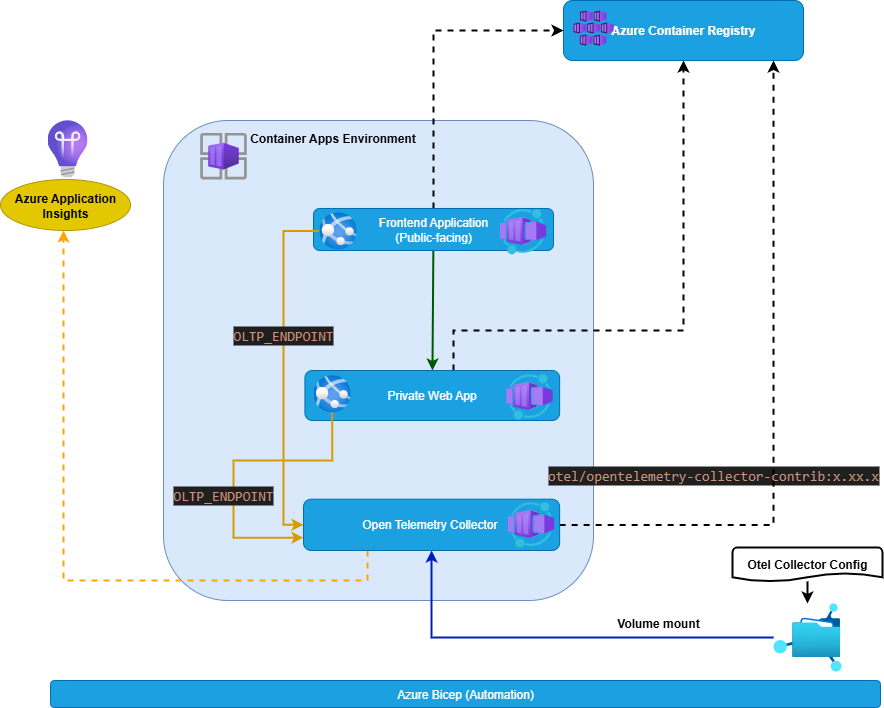
To start enabling observability, we need to deploy an OpenTelemetry Collector as a container in Azure Container Apps.
The Collector acts as a telemetry gateway, receiving data from your applications, processing it, and exporting it to monitoring backends like Azure Monitor and Application Insights.
Below is a sample configuration for the Collector. This setup receives telemetry over the OTLP protocol, enriches it with metadata about the container app, filters out unwanted spans (such as health checks), and exports the data to Azure Monitor as well as to the console (logging) for debugging.
1. OpenTelemetry Collector configuration
receivers:
  otlp:                      # Receiver for OpenTelemetry Protocol (OTLP)
    protocols:
      grpc:                  # Enables OTLP over gRPC
      http:                  # Enables OTLP over HTTP

processors:
  batch:                     # Batches telemetry before exporting (improves performance)
  attributes/collector_info: # Adds custom attributes (metadata) to all telemetry
    actions:
      - key: collector.hostname
        value: $HOSTNAME
        action: insert
      - key: azure.container_app.revision
        value: $CONTAINER_APP_REVISION
        action: insert
      - key: azure.container_app.name
        value: $CONTAINER_APP_NAME
        action: insert
  filter/healthcheck:        # Filters out health check spans so they don’t pollute traces
    spans:
      exclude:
        match_type: strict
        attributes:
          - key: http.target
            value: /health

exporters:
  azuremonitor:              # Exports telemetry to Azure Monitor / Application Insights
    connection_string: "${APPINSIGHTS_CONN_STRING}"
  logging:                   # Debug exporter (prints telemetry to logs)
    loglevel: debug

service:
  telemetry:
    logs:
      level: debug           # Sets Collector internal logs to debug level
  pipelines:
    traces:                  # Trace pipeline (for distributed tracing data)
      receivers: [otlp]
      processors: [batch, attributes/collector_info, filter/healthcheck]
      exporters: [azuremonitor, logging]
    metrics:                 # Metrics pipeline (for custom & system metrics)
      receivers: [otlp]
      processors: [batch, attributes/collector_info]
      exporters: [azuremonitor, logging]
    logs:                    # Logs pipeline (structured application logs)
      receivers: [otlp]
      processors: [batch, attributes/collector_info]
      exporters: [azuremonitor, logging]
This config ensures that all three signals (traces, metrics, logs) are collected, enriched, and sent to Azure Monitor while also being logged for troubleshooting.
2. Deploy an OpenTelemetry Collector inside Azure Container Apps
This setup provisions the Storage + File Share, uploads the Collector configuration, and deploys an OpenTelemetry Collector container app that mounts and uses the configuration at runtime.
Before running the OpenTelemetry Collector in Azure Container Apps, we need to prepare the observability infrastructure.
This involves creating a Storage Account with a File Share, uploading the Collector configuration, and mounting that File Share inside the Container App.
File Share Mount into Container App Environment
- Creates a storage mount resource inside the Container App’s managed environment.
- Connects to the Azure Storage Account and its File Share.
- Makes the
config.yamlfile available inside the container at runtime.
Container App Definition
Configuration
- Provides the Application Insights connection string as a secret.
- Configures the OTLP ingress port for telemetry input.
Template
- Runs the OpenTelemetry Collector using the official image
otel/opentelemetry-collector-contrib:0.98.0. Replace 0.98.0 with current version - Loads the configuration from
/etc/otelcol/config.yaml. - Mounts the Azure File Share at
/etc/otelcol.
Volumes
- Declares a volume of type AzureFile pointing to the File Share.
- Ensures that the configuration file is persisted and accessible.
// === File Share Mount into Container App Environment ===
resource fileShareMount 'Microsoft.App/managedEnvironments/storages@2023-05-01' = {
  parent: containerEnv
  name: fileShareName
  properties: {
    azureFile: {
      accountName: storageAccountName
      shareName: fileShareName
      accountKey: storageAccountKey
      accessMode: 'ReadWrite'
    }
  }
}

// === Container App ===
resource containerApp 'Microsoft.App/containerApps@2025-01-01' = {
  name: containerAppName
  location: location
  properties: {
    managedEnvironmentId: containerEnv.id
    configuration: {
      secrets: [
        {
          name: 'appinsights-conn'
          value: appInsights.properties.ConnectionString
        }
      ]
      activeRevisionsMode: 'Single'
      ingress: {
        external: false
        targetPort: 4318
        transport: 'auto'
        allowInsecure: false
      }
    }
    template: {
      containers: [
        {
          name: 'collector'
          image: 'otel/opentelemetry-collector-contrib:0.98.0'
          command: []
          args: [
            '--config=/etc/otelcol/config.yaml'
          ]
          env: [
            {
              name: 'APPINSIGHTS_CONN_STRING'
              secretRef: 'appinsights-conn'
            }
          ]
          resources: {
            cpu: json('0.5')
            memory: '1.0Gi'
          }
          volumeMounts: [
            {
              mountPath: '/etc/otelcol'
              volumeName: 'config'
            }
          ]
        }
      ]
      volumes: [
        {
          name: 'config'
          storageType: 'AzureFile'
          storageName: fileShareName
        }
      ]
      scale: {
        minReplicas: 1
        maxReplicas: 1
      }
    }
  }
  dependsOn: [

    fileShareMount
  ]
}
3. Configure the Collector to receive telemetry data from your application
Azure container registry
deploys an Azure Container Registry to store application images and assigns the AcrPull role to a user-assigned managed identity, allowing it to pull images from that registry.
Azure container apps ( webapp and webapi)
This configuration deploys two Container Apps, weatherforecast-app and weatherforecast-api, within an existing Container Apps environment. Both apps use container images pulled from an existing Azure Container Registry, authenticated through a user-assigned managed identity.
The setup includes:
-
Ingress disabled externally for the API (internal access only), listening on port 8080 over HTTP.
-
Secrets to securely store the OTLP endpoint, injected into the container as an environment variable.
-
Environment variables for the .NET environment and the OTLP endpoint reference.
4. Validate telemetry collection with sample applications
This code defines extension methods that integrate observability into an ASP.NET Core application by configuring metrics, traces, and logs with OpenTelemetry and Serilog, exporting all data to a specified OTLP endpoint.
- Sets up metrics and tracing via OpenTelemetry.
- Adds Prometheus and OTLP exporters.
- Configures Serilog to send logs to the same OTLP endpoint.
public static class ObservabilityExtensions
{
    public static IServiceCollection AddObservability(this IServiceCollection services,
        string serviceName, string sourceName, IConfiguration configuration)
    {
        var resource = ResourceBuilder.CreateDefault()
            .AddService(serviceName: serviceName, serviceVersion: "1.0");

        var oltpEndpoint = configuration["OLTP_ENDPOINT"]
            ?? throw new InvalidOperationException("OLTP_ENDPOINT configuration is missing.");

        services.AddOpenTelemetry()
            .WithMetrics(metrics =>
            {
                metrics.SetResourceBuilder(resource)
                       .AddAspNetCoreInstrumentation()
                       .AddHttpClientInstrumentation()
                       .AddProcessInstrumentation()
                       .AddRuntimeInstrumentation()
                       .AddPrometheusExporter()
                       .AddOtlpExporter(opt =>
                       {
                           opt.Endpoint = new Uri($"{oltpEndpoint}/v1/metrics");
                       });
            })
            .WithTracing(tracing =>
            {
                tracing.SetResourceBuilder(resource)
                       .AddSource(sourceName)
                       .AddAspNetCoreInstrumentation()
                       .AddHttpClientInstrumentation()
                       .AddSqlClientInstrumentation()
                       .AddEntityFrameworkCoreInstrumentation()
                       .AddOtlpExporter(opt =>
                       {
                           opt.Endpoint = new Uri($"{oltpEndpoint}/v1/traces");
                       });
            });

        return services;
    }

    public static void AddSerilog(this WebApplicationBuilder builder, string serviceName, IConfiguration configuration)
    {
        var oltpEndpoint = configuration["OLTP_ENDPOINT"]
            ?? throw new InvalidOperationException("OLTP_ENDPOINT configuration is missing.");

        builder.Host.UseSerilog((context, config) =>
        {
            config.ReadFrom.Configuration(context.Configuration)
                  .Enrich.FromLogContext()
                  .WriteTo.Console()
                  .WriteTo.OpenTelemetry(options =>
                  {
                      options.Endpoint = $"{oltpEndpoint}/v1/logs";
                      options.ResourceAttributes = new Dictionary<string, object>
                      {
                          ["service.name"] = serviceName
                      };
                  });
        });
    }
}
5. deploy observability infrastructure
This PowerShell and Azure CLI script sets up a resource group and deploys resources using a Bicep template:
# Get the current Azure subscription ID and set it as active
$subscriptionId = (Get-AzContext).Subscription.Id
az account set --subscription $subscriptionId

# Define the resource group name and create it in France Central
$resourceGroupName = "RG-ACA-OTEL-COLLECTOR"
New-AzResourceGroup -Name $resourceGroupName -Location "francecentral"

# Deploy resources from the main.bicep template into the resource group
az deployment group create --resource-group $resourceGroupName --template-file main.bicep
6. build and push application image to container registry
- Logs into the Azure Container Registry named
datasyncotelcr. - Builds the Web API Docker image and pushes it to the registry.
- Builds the Web App Docker image and pushes it to the registry.
This script builds and pushes container images to an Azure Container Registry (ACR) using Docker and Azure CLI:
# Set the ACR name and log in
$acrName = "datasyncotelcr"
az acr login --name $acrName

# Build and push the Web API image
docker build -t "$acrName.azurecr.io/web-api:latest" -f .\src\OtelReferenceApp\WebApi\Dockerfile .\src\OtelReferenceApp\ --no-cache
docker push "$acrName.azurecr.io/web-api:latest"

# Build and push the Web App image
docker build -t "$acrName.azurecr.io/web-app:latest" -f .\src\OtelReferenceApp\WebApp\Dockerfile .\src\OtelReferenceApp\ --no-cache
docker push "$acrName.azurecr.io/web-app:latest"
7. Deploy Web App and Web API
This script deploys the web application and web API to Azure using the Bicep template:
# Define the resource group name
$resourceGroupName = "RG-ACA-OTEL-COLLECTOR"

# Deploy resources with the deployApps parameter enabled
az deployment group create --resource-group $resourceGroupName --template-file main.bicep --parameters deployApps=true
8. Test and verify the deployed applications and the observability setup
- Locate the
weatherforecast-appin the Azure resource group (in this example,RG-ACA-OTEL-COLLECTOR). - Click the Application URL link.
- The frontend web application will open in your browser.
- Click the WeatherForecast button (or link in the menu) to call the web API.
<br />
- Go to Azure Application Insights and click on Application Map to visualize the traces from the web app to the web API.
- Finally, navigate to Metrics (under the Monitoring menu of Application Insights), choose Custom Metrics in the metric namespace, and select a metric to view.
logs
This Kusto Query Language (KQL) snippet queries application traces in Azure Monitor:
- Retrieves warning and error traces from
WeatherForecast.WebApporWeatherForecast.WebApi. - Shows timestamp, message, and logger category.
- Orders results by most recent first.
traces
| where  severityLevel >= 1              // filter Warning/Error
| where cloud_RoleName == "WeatherForecast.WebApp"
| project LogTime = timestamp,
          Message = message,
          Logger = customDimensions.CategoryName
| order by LogTime desc


traces
| where  severityLevel >= 1              // filter Warning/Error
| where cloud_RoleName == "WeatherForecast.WebApi"
| project LogTime = timestamp,
          Message = message,
          Logger = customDimensions.CategoryName
| order by LogTime desc
traces
This Kusto Query Language (KQL) snippet queries requests and dependencies in Azure Monitor for the WeatherForecast applications:
- Retrieves request logs for both Web API and Web App, including timestamp, name, duration, and success status.
- Retrieves external dependency calls from Web App, including timestamp, target, type, and result code.
- Orders all results by timestamp in descending order.
requests
| where cloud_RoleName == "WeatherForecast.WebApi"
| project RequestTime = timestamp,
          Name = name,
          Duration = duration,
          Success = success
| order by RequestTime desc

requests
| where cloud_RoleName == "WeatherForecast.WebApp"
| project RequestTime = timestamp,
          Name = name,
          Duration = duration,
          Success = success
| order by RequestTime desc

// External dependencies
dependencies
| where cloud_RoleName == "WeatherForecast.WebApp"
| project DepTime = timestamp,
          Target = target,
          Type = type,
          ResultCode = resultCode
| order by DepTime desc
metrics
This Kusto Query Language (KQL) snippet queries custom metrics in Azure Monitor for the WeatherForecast applications:
- Retrieves custom metrics from both Web API and Web App.
- Projects timestamp, metric name, type, and value for each metric.
- Helps monitor application-specific performance and behavior over time.
customMetrics
 | where cloud_RoleName == "WeatherForecast.WebApi"
 | project Time = timestamp,
            Type = "metric",
            Name = name, value

customMetrics
 | where cloud_RoleName == "WeatherForecast.WebApp"
 | project Time = timestamp,
            Type = "metric",
            Name = name, value
container crashing
This Kusto Query Language (KQL) snippet queries system logs for the WeatherForecast API container app in Azure Monitor:
- Retrieves system logs for the weatherforecast-api container app.
- Filters logs to include only events where the container is crashing.
- Projects the timestamp, revision name, and log details for each crash event.
ContainerAppSystemLogs_CL
| where ContainerAppName_s =="weatherforecast-api"
| where Reason_s == "ContainerCrashing"
| project TimeGenerated, RevisionName_s, Log_s
otel collector logs
This Kusto Query Language (KQL) snippet queries console logs for the OpenTelemetry Collector container app in Azure Monitor:
- Retrieves console logs for the datasync-otel-collector container app.
- Allows monitoring of application output, debugging, and troubleshooting.
ContainerAppConsoleLogs_CL
| where ContainerAppName_s =="datasync-otel-collector"
github repository
https://github.com/azurecorner/azure-container-apps-observability
Related Posts
 Migrating JWT from ASP.NET Core 1.x to ASP.NET Core 2.0
 A Developers Guide to Azure SQL Data Warehouse
 Angular JS Token Based Authentication using Asp.net Core Web API 2.0 and JSON Web Token
 Asp.Net Core 2.0 Web Api Unit Testing
 Building micro services through Event Driven Architecture part23 : Azure Kubernetes Services
 Build 2016 : Docker Tooling for Visual Studio and ASP NET Core