Building micro services through Event Driven Architecture part21 : Monitoring and Observability
Building micro services through Event Driven Architecture part21 : Monitoring and Observability
This tutorial is the 20th part of a series : Building microservices through Event Driven Architecture.
Observability Design principal is very important in a microservice Architecture. We must be able to monitor and react to alerts when problem occurs during services processing. I need to be able to trace requests and responses with correlation, monitor logs, traces, metrics in real time. It should be easy to diagnose and troubleshoot any issue across all microservices.
Among the key elements of Observability Design, we can mention:
Crentral Logging
Send logs to a central system, logs requets ,responses , issues, etc…
Workflow traceability
Use structured logging, logs levels , correlationIds
Error Traceability
Exception details, call stack information, etc…
Central Monitoring
Real time monitoring, metrics, events, etc…
Alerting
Real time alertings
To learn more about observability core concept, you can follow this link : https://opentelemetry.io/docs/concepts/observability-primer/
In this tutorial I will use OpenTelemetry which provide a set of standardized vendor-agnostic SDKs, APIs, and tools for ingesting, transforming, and sending data to an Observability back-end (i.e. open source or commercial vendor). https://opentelemetry.io/docs/concepts/what-is-opentelemetry/
I will aslo use Serilog which is built with powerful structured event data and provides sinks for writing log events to storage in various formats https://serilog.net/
Enable OpenTelemetry
OpenTelemetry for .NET is unique among OpenTelemetry implementations, as it is integrated with the .NET System.Diagnostics library. At a high level, you can think of OpenTelemetry for .NET as a bridge between the telemetry available through System.Diagnostics and the greater OpenTelemetry ecosystem, such as OpenTelemetry Protocol (OTLP) and the OpenTelemetry Collector.
To learn more about OpenTelemetry for .NET, please read the following https://opentelemetry.io/docs/instrumentation/net/getting-started/
dotnet add package OpenTelemetry.Exporter.Console
dotnet add package OpenTelemetry.Extensions.Hosting --prerelease
dotnet add package OpenTelemetry.Instrumentation.AspNetCore --prerelease
dotnet add package OpenTelemetry.Instrumentation.Http --prerelease
dotnet add package OpenTelemetry.Instrumentation.SqlClient --prerelease
using System.Diagnostics;
using OpenTelemetry.Resources;
using OpenTelemetry.Trace;
// Define some important constants to initialize tracing with
var serviceName = "MyCompany.MyProduct.MyService";
var serviceVersion = "1.0.0";
var builder = WebApplication.CreateBuilder(args);
// Configure important OpenTelemetry settings, the console exporter, and instrumentation library
builder.Services.AddOpenTelemetryTracing(tracerProviderBuilder =>
{
tracerProviderBuilder
.AddConsoleExporter()
.AddSource(serviceName)
.SetResourceBuilder(
ResourceBuilder.CreateDefault()
.AddService(serviceName: serviceName, serviceVersion: serviceVersion))
.AddHttpClientInstrumentation()
.AddAspNetCoreInstrumentation()
.AddSqlClientInstrumentation();
});
var app = builder.Build();
var MyActivitySource = new ActivitySource(serviceName);
app.MapGet("/hello", () =>
{
// Track work inside of the request
using var activity = MyActivitySource.StartActivity("SayHello");
activity?.SetTag("foo", 1);
activity?.SetTag("bar", "Hello, World!");
activity?.SetTag("baz", new int[] { 1, 2, 3 });
return "Hello, World!";
});
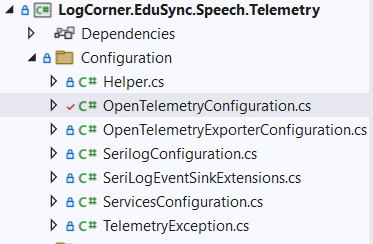
app.Run();To enable open temelemetry, I created a LogCorner.EduSync.Speech.Telemetry projet
- Define some extensions methods to setup and configure exporters
2. Open appsettings.json file and add the following configuration : ServiceName, SourceName and exporter endpoints
"OpenTelemetry": {
    "ServiceName": "LogCorner.EduSync.Speech.Command.Dev",
    "SourceName": "command-http-api",
    "Jaeger": {
      "Hostname": "localhost",
      "PortNumber": 6831
    },
    "Zipkin": {
      "Hostname": "localhost",
      "PortNumber": 9412
    },
    "NewRelic": {
      "Hostname": "https://otlp.nr-data.net",
      "PortNumber": 4317,
      "LicenceKey": "[NewRelicApiKey]"
    }
  }
3. Open Startup.cs class and the following to ConfigureServices method
services.AddOpenTelemetry(Configuration);
4. Open Program.cs class and add the following to configure logging
 .ConfigureLogging((context, loggingBuilder) =>
                {
                    loggingBuilder.ClearProviders();
                    loggingBuilder.AddConsole();
                    loggingBuilder.AddSerilog(context.Configuration);
                    loggingBuilder.AddOpenTelemetry(context.Configuration);
                })
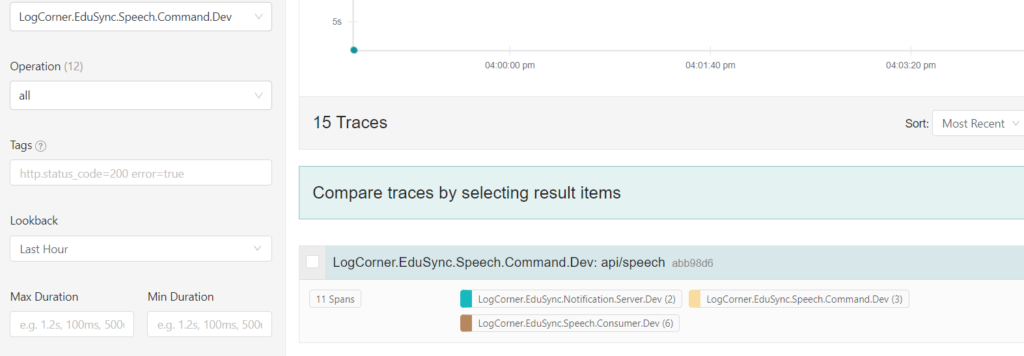
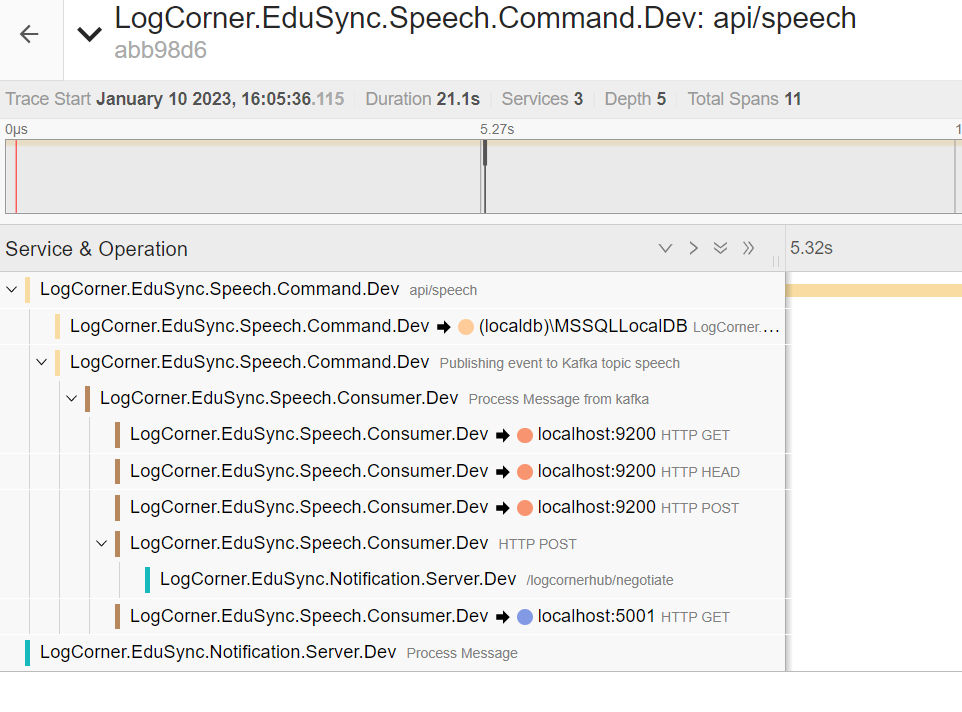
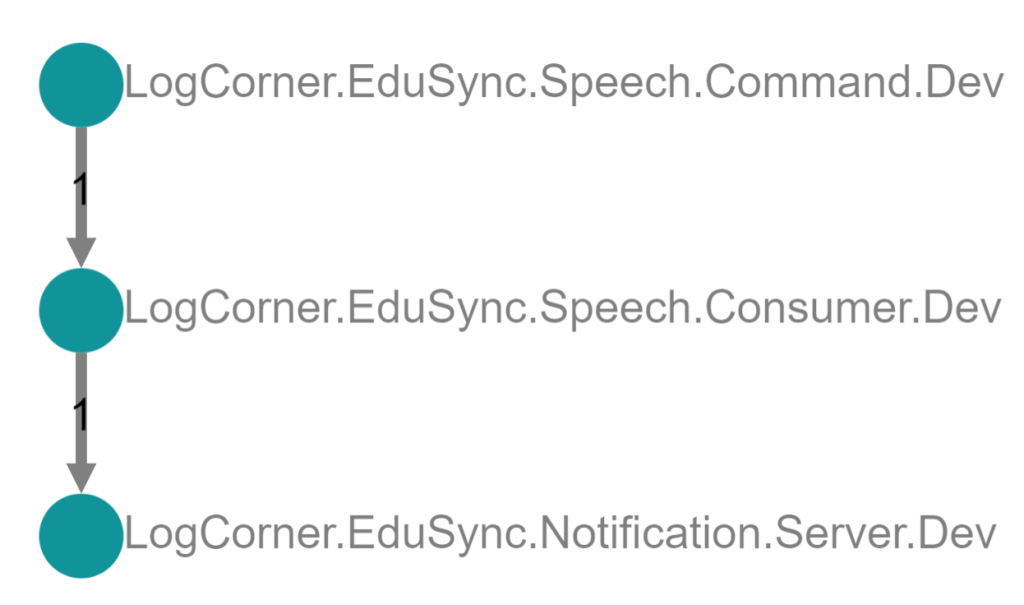
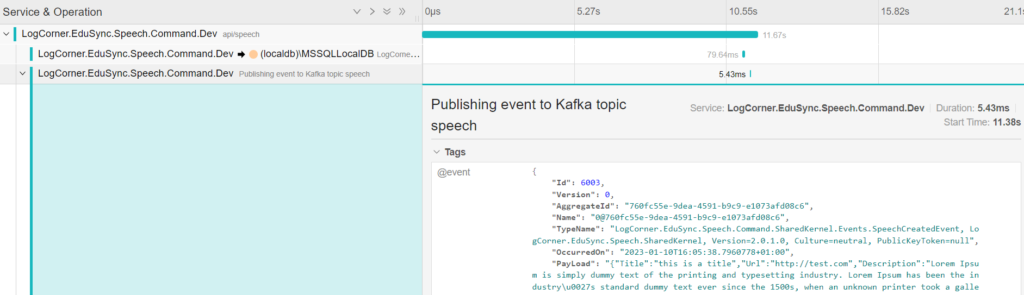
See it in action
Nagivate through .\LogCorner.EduSync.Speech.Broker\src folder and run the following command :
docker-compose -f docker-compose.yml up
Jargaer
http://localhost:16686/search
Zipkin
http://localhost:9412/zipkin/
Code source is available here :
Thanks for reading, if you have any feedback, feel free to post it
Related Posts
 Building micro services through Event Driven Architecture part25 : automate workflows to build, test, and deploy code from GitHub using GitHub Actions
 Building micro services through Event Driven Architecture part24 : deploy and manage applications on a Kubernetes cluster using helm charts
- Building micro services through Event Driven Architecture part23 : Azure Kubernetes Services
 Azure-Managed-Identities-Workload-Identity-Federation-Azure-Kubernetes-Services
 Building micro services through Event Driven Architecture part22 : Kubernetes
 Building micro services through Event Driven Architecture part20 : Shared Libraries